Tests of Hypotheses
Learning Objectives
- Understand the formal framework and key terminology of hypothesis testing.
- Differentiate between Type I and Type II errors and understand the concept of statistical power.
- Identify and perform common hypothesis tests for single and two population means.
- Perform hypothesis tests for single proportions and variances.
- Apply Chi-Square Goodness-of-Fit tests to check theoretical distributions.
- Explain the mathematical duality between confidence intervals and hypothesis tests.
Introduction to Hypothesis Testing
While estimation focuses on finding the value of a population parameter, hypothesis testing focuses on making decisions about a population parameter based on sample data. An engineer might ask: "Does this new steel alloy have a mean tensile strength greater than ?" or "Is the variance in asphalt thickness less than ?" Hypothesis testing provides a formal, objective framework to answer these yes-or-no questions.
The Framework of Hypothesis Testing
The formal steps required to set up and evaluate a statistical test involve defining the null and alternative hypotheses, calculating a test statistic, and making a decision based on a P-value or critical value.
1. Null Hypothesis ()
The statement of the status quo, no effect, or no difference. It always contains an equality sign (, , ). We assume is true until the sample data provides overwhelming evidence to the contrary.
Example: (The new alloy is no stronger than the old one).
2. Alternative Hypothesis ( or )
The alternative claim that contradicts and represents the effect being investigated. It uses a directional or two-sided inequality (, , or ). A test can provide evidence against ; it does not prove .
Example: (The new alloy is stronger).
3. Test Statistic
A standardized value calculated from the sample data (e.g., a Z-score, t-score, or value) assuming is true. It measures how far our sample result is from the null hypothesis value, expressed in units of standard error.
4. P-Value
Assuming and the test model are true, the probability of obtaining a test statistic at least as extreme as the observed value in the direction(s) defined by . It is not the probability that is true.
Interpreting P-Values
- The P-value is calculated assuming and the test model. If it is at most the preselected , reject .
- Otherwise, fail to reject it; a large P-value is not proof that is true.
5. Significance Level ()
The rejection threshold selected before analyzing the result. For a size- test, the probability of rejecting is no greater than when the null holds. Common choices include , , and ; the choice depends on the study's error costs.
Decision Rule
If the P-value , reject . If the P-value , fail to reject .
Apply and Interpret a Preselected Hypothesis Test
Prespecify the hypotheses and significance level, confirm the method's assumptions, then interpret its p-value in context.
A level-alpha test controls the Type I error probability under the null. Rejecting provides evidence against the null under the model; failing to reject means evidence is insufficient, not that the null has been proven.
Start with a design-matched test → Set H0, Ha direction, and alpha before results; Set H0, Ha direction, and alpha before results → Are the test assumptions and data basis supportable?; Are the test assumptions and data basis supportable? — No → Revise the method or study plan; Are the test assumptions and data basis supportable? — Yes → Calculate the statistic and p value; Calculate the statistic and p value → Is p <= alpha?; Is p <= alpha? — Yes → Reject H0; report evidence for Ha in context; Is p <= alpha? — No → Fail to reject H0; report insufficient evidence
- Start with a design-matched test: terminator
- Set H0, Ha direction, and alpha before results: process
- Are the test assumptions and data basis supportable?: decision
- Revise the method or study plan: terminator
- Calculate the statistic and p value: process
- Is p <= alpha?: decision
- Reject H0; report evidence for Ha in context: terminator
- Fail to reject H0; report insufficient evidence: terminator
Errors in Decision Making and Statistical Power
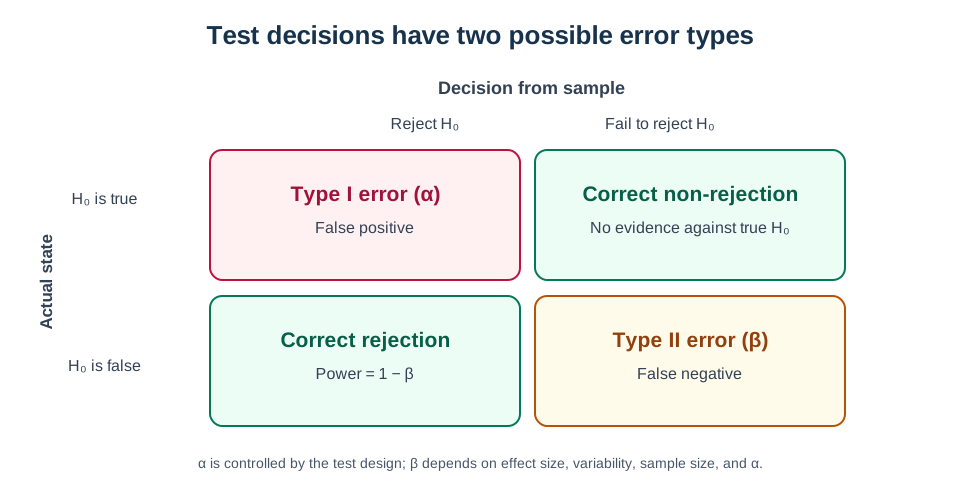
Because we rely on partial information (a sample) to make decisions about a population, we are at risk of making mistakes. The risks inherent in statistical inference are classified into two types of errors.
Type I Error ()
Rejecting a true null hypothesis (a "false positive"). A level- test limits this error probability to at most under the null; it is not necessarily exactly for every value covered by a composite null.
Type II Error ()
Failing to reject a false null hypothesis (a "false negative"). Its probability depends on the true effect size, variability, sample size, and the chosen test and .
Statistical Power ()
The probability of correctly rejecting a false Null Hypothesis. A highly powerful test is very likely to detect a real difference if one exists.
The four truth-and-decision outcomes
Alpha bounds Type I error for a level-alpha test; power is one minus beta at a specified alternative. This is a conceptual classification, not observed data.
Factors Affecting Statistical Power
- Power increases as the true difference (effect size) increases.
- Power increases as the significance level increases (but this raises the risk of a Type I error).
- Power increases as the sample size increases. Engineers often calculate the minimum sample size needed to achieve a specific power (e.g., 80%) before running an expensive test.
Tests for a Single Population Mean ()
Testing claims about the center of a population. Depending on whether the population variance is known or unknown, different test statistics are used.
- Z-Test (Variance Known): Rarely used in practice. Assumes population variance is known.
- t-Test (Variance Unknown): The standard test. Uses the sample standard deviation .
Z-Test Statistic for a Single Mean
Used when the population variance is known.
t-Test Statistic for a Single Mean
Used when the population variance is unknown, with degrees of freedom .
Select a One-Sample Mean Test
For a single population mean, select the reference distribution from whether the population standard deviation is known.
A z test uses a known population sigma; when sigma is estimated from the sample, use the t procedure with its degrees of freedom. The sampling and distribution assumptions still need review.
One population mean is the target → Is population sigma known?; Is population sigma known? — Yes → Select a one-sample z test; Is population sigma known? — No → Select a one-sample t test
- One population mean is the target: terminator
- Is population sigma known?: decision
- Select a one-sample z test: terminator
- Select a one-sample t test: terminator
Tests for Two Population Means ()
Comparing two different groups (e.g., compressive strength of Mix A vs. Mix B).
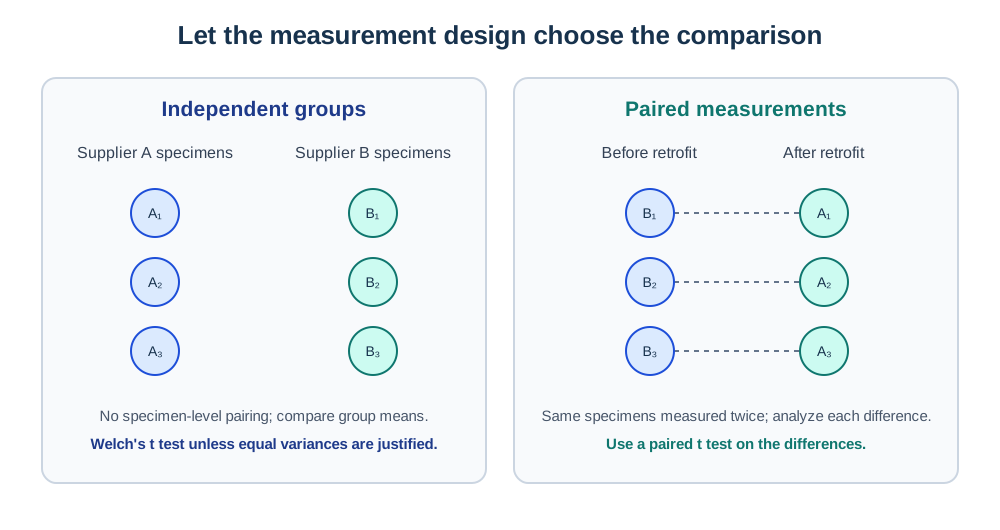
- Independent Samples (Welch's t-Test): Does not assume equal population variances and is a sound default for independent groups.
- Independent Samples (Pooled t-Test): Assumes equal population variances; use it when that assumption is justified by the design and subject-matter evidence.
- Paired t-Test (Dependent Samples): Used when observations are naturally paired or matched (e.g., measuring the stiffness of the exact same beam before and after a retrofitting procedure). The test is performed on the differences between paired values, treating them as a single sample.
Choose the two-sample design from the observation structure
Use a paired analysis only when measurements are matched by unit or a prespecified pairing. For independent groups, Welch's test avoids assuming equal population variances; a pooled test requires that additional assumption. The diagram distinguishes study design and does not show measured data.
Select a Two-Mean Comparison Test
Identify matched measurements first; for independent groups, use a pooled comparison only when equal population variances are justified.
A paired test analyzes within-unit differences. For independent groups, Welch's t test does not assume equal population variances; a pooled t test requires that assumption.
Compare two population means → Are observations paired by unit?; Are observations paired by unit? — Yes → Use a paired t test on within-unit differences; Are observations paired by unit? — No → Are equal population variances justified?; Are equal population variances justified? — Yes → Use the pooled independent-samples t test; Are equal population variances justified? — No → Use Welch's independent-samples t test
- Compare two population means: terminator
- Are observations paired by unit?: decision
- Use a paired t test on within-unit differences: terminator
- Are equal population variances justified?: decision
- Use Welch's independent-samples t test: terminator
- Use the pooled independent-samples t test: terminator
Tests for a Single Proportion ()
Testing categorical outcomes (e.g., percentage of defective items). The one-proportion test uses a normal approximation and requires the null-based expected counts and ; use an exact binomial method or another justified procedure when this approximation is not adequate.
Z-Test Statistic for a Single Proportion
Used to test a hypothesis about a population proportion.
Tests for a Single Variance ()
Testing claims about the variability or consistency of a process. Uses the Chi-square () distribution. Highly sensitive to departures from normality in the population.
Chi-Square Test Statistic for a Single Variance
Used to test a hypothesis about a population variance, with degrees of freedom .
Select a One-Variance Test
The one-sample Chi-Square variance test depends on a normal-population model; use another suitable method when that model is not supportable.
The classical one-variance Chi-Square test is sensitive to nonnormality. A graphical screen is not proof of normality; the model and data basis need substantive review.
One population variance is the target → Is a normal-population model supportable?; Is a normal-population model supportable? — Yes → Select the one-variance Chi-Square test; Is a normal-population model supportable? — No → Select a suitable robust variance method
- One population variance is the target: terminator
- Is a normal-population model supportable?: decision
- Select the one-variance Chi-Square test: terminator
- Select a suitable robust variance method: terminator
Chi-Square Goodness-of-Fit Test
Used to determine whether a sample follows an expected probability distribution (e.g., "Is the arrival of cars at this intersection truly Poisson distributed?" or "Are these soil samples normally distributed?").
Goodness-of-Fit Tests
Checking if data follows a specific theoretical distribution. This is essential for validating the assumptions underlying other statistical methods.
- : The data follows the specified distribution.
- : The data does not follow the specified distribution.
- A large value means the observed data deviates significantly from what was expected, leading to rejection of .
Chi-Square Goodness-of-Fit Test Statistic
Calculates the deviation between observed and expected frequencies.
Select a Categorical Hypothesis Test
Distinguish one-proportion inference from categorical goodness-of-fit, then check whether the proposed approximation is supportable.
A one-proportion z test needs adequate null expected counts; sparse counts call for an exact or otherwise justified method. A Chi-Square goodness-of-fit approximation also requires suitable expected frequencies and degrees of freedom.
Define the categorical response and target → Is one population proportion the target?; Is one population proportion the target? — Yes → Do null expected counts support a z approximation?; Is one population proportion the target? — No → Compare category counts with a model using adequate expected frequencies?; Do null expected counts support a z approximation? — Yes → Select a one-proportion z test; Do null expected counts support a z approximation? — No → Select an exact binomial or justified alternative; Compare category counts with a model using adequate expected frequencies? — Yes → Select a Chi-Square goodness-of-fit test; Compare category counts with a model using adequate expected frequencies? — No → Select a design-matched categorical method
- Define the categorical response and target: terminator
- Is one population proportion the target?: decision
- Do null expected counts support a z approximation?: decision
- Select a one-proportion z test: terminator
- Select an exact binomial or justified alternative: terminator
- Compare category counts with a model using adequate expected frequencies?: decision
- Select a Chi-Square goodness-of-fit test: terminator
- Select a design-matched categorical method: terminator
The Connection Between Confidence Intervals and Hypothesis Tests
There is a direct, mathematical duality between Confidence Intervals and two-sided Hypothesis Tests. If a 95% CI for the mean is , then a two-sided hypothesis test (with ) will:
- Fail to reject (because is inside the interval).
- Reject (because is outside the interval).
Interactive Simulation
Change the observed z statistic and the direction of the alternative to see which tail probabilities enter the hypothesis test.
Controls
Select the direction of departure from the null that counts as evidence.
Chosen Type I error rate under the null. It sets the size of the critical region.
Signed distance of the observation from the null expectation in standard-error units.
Reject the null hypothesis
P-Value and Significance Level Visualization
Change the p-value, significance level (), and direction of the alternative to compare the shaded probability with the marked critical thresholds of the standard normal null distribution.
Controls
Select the direction of departure from the null that counts as evidence.
Chosen Type I error rate under the null. It sets the size of the critical region.
Tail probability under the null. A one-sided probability above 0.5 places the statistic on the opposite side of zero.
Reject the null hypothesis
- and : Formulate mutually exclusive hypotheses; contains equality.
- P-value: Under and the test model, the probability of a statistic at least as extreme as observed in the direction(s) specified by ; reject when it is at most the preselected .
- Type I Error (): False positive (rejecting true ).
- Type II Error (): False negative (failing to reject false ).
- Power (): The probability of correctly identifying a real effect. Highly dependent on sample size.
- Goodness-of-Fit (): Tests whether observed categorical data matches an expected distribution.
- Duality: A 95% Confidence Interval contains all values of the parameter that would not be rejected by a two-sided test at .
References
- NIST/SEMATECH e-Handbook of Statistical Methods — Tests of Hypotheses
- NIST/SEMATECH e-Handbook of Statistical Methods — Confidence Intervals and Tests
- NIST/SEMATECH e-Handbook of Statistical Methods — Does the Proportion of Defectives Meet Requirements? — null-based expected-count condition for the one-proportion normal approximation.
- NIST/SEMATECH e-Handbook of Statistical Methods — Chi-Square Test for a Variance